When LTE first arrived, phone calls were still made using the older 3G network. It wasn’t until later on that Voice over LTE, or VoLTE, service was introduced. The same thing is happening today with 5G service. Voice calls still mainly utilize LTE services. That’s even in locations where 5G data coverage is widely available.
As of today, T-Mobile announced they would be supporting Voice over 5G. This technology is referred to as Voice over New Radio, or VoNR.
“5G is already driving new levels of engagement, transforming how our customers use their smartphones and bringing unprecedented connectivity to areas that desperately need it,” said Neville Ray, President of Technology at T-Mobile. “And it’s just going to get better thanks to the incredible T-Mobile team and our partners who are tirelessly innovating and advancing the capabilities of 5G every day.”
Rollout will start in Portland, Oregon and Salt Lake City, Utah, where some commercial calls will be routed via T-Mobile’s standalone 5G network. The service will only be available in “limited areas” of these cities.
In order for to obtain VoNR, your phone must support the new technology. This is no different than how Voice over LTE functioned. Your phone must support it and you must have the feature enabled on the phone. Currently, only one phone supports it – the Samsung Galaxy S21 5G smartphone.
It’s likely that other carriers will begin to follow suit when they see the benefits – not only the lower latency, but more of the LTE spectrum can be cleared out to make room for additional 5G service. Dish Network, for example, does not have an existing LTE network to fall back on so they are relying on a deal with AT&T while they work on their own VoNR services.
It’s been about two weeks now that AT&T legacy subscribers got a shock that AT&T would be raising their prices in June. Verizon is now jumping on that same bandwagon and increasing prices for consumer and business accounts.
Verizon CEO Hans Vestberg first mentioned increasing prices back in April, saying that inflation was to blame. While he did not say they were definitely coming, he instead said that the carrier had “plans to be prepared for what it takes,” including “different types of cost adjustments.”
It has actually been two years since Verizon has raised prices for these customers. Although back in late 2021, the carrier increased prices on customers grandfathered into older plans.
As first reported by Bloomberg (and confirmed by Verizon reps), Verizon has taken an interesting approach to how they are advertising the rising prices. Instead of raising the actual plans, they will instead begin adding a new “economic adjustment charge” to your bill every month.
According to Verizon, the “economic adjustment charge” will be $1.35 per voice line for consumers. Note that we said voice as the increase applies only to voice lines per account.
Business customers will receive a larger increase every month, with data plans increasing by $2.20 per month and “basic service plans” increasing by $0.98 per month.
Verizon began alerting consumers of this new “economic adjustment charge” yesterday, while it has also been in direct contact with “some of its larger corporate clients” recently. They say pricing will go up starting in June and the “economic adjustment charge” will apply to ALL plans.
OpenSignal is known for its mobile analytics. Each year they release a few reports about the major cellular carriers’ networks. They take results gathered from millions of devices, which result in billions of measurements. The latest data gathered, which was collected between September and December of last year, shows T-Mobile is on top once again.
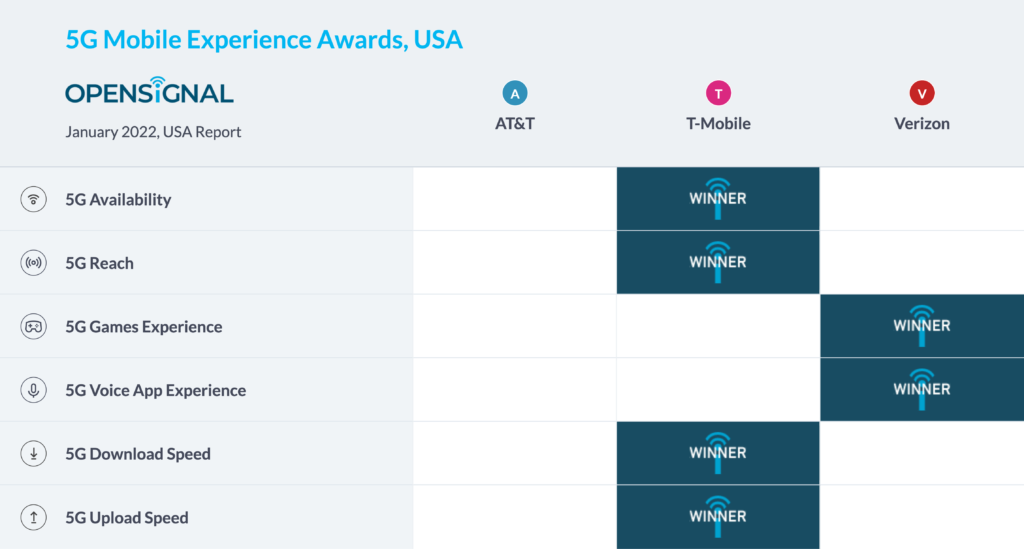
Analysis was done in 43 states, as well as the capital of Washington, D.C., for each of the carriers strictly on their 5G network experience. The report covered: Availability, Reach, Games Experience, Voice App Experience, Download Speed and Upload Speed.
T-Mobile was not the only winner though. Verizon also picked up the categories of Games Experience and Voice App Experience. Sadly, for AT&T, they didn’t win any categories, but still presented good results in comparison to its competitors. It’s no wonder given that T-Mobile has not had to deal with the issues surrounding C-Band that AT&T and Verizon have. This service was originally delayed, then limited to certain locations – all because of possible interference with aircraft tools that also work around the C-Band spectrum.
While Verizon has the best user experience, T-Mobile dominates the speed categories. In fact, they’ve been at the top of the Download Speed category for six times in a row and Upload Speeds for the fifth time in a row.
T-Mobile also won the Availability and Reach categories. It’s clear their lead on getting mid-band service out to 200 million users was a success. This is what they have dubbed their “Ultra Capacity 5G” service. It relies on the 2.5 Ghz band, so it is unaffected by the FAA concerns that have affected the C-Band.
Now let’s take a closer look at how all the carriers fared in each category, at the National Analysis level.
Note that each of the OpenSignal charts listed below have brackets at the end of their respective graphs. These brackets represent confidence intervals. Per OpenSignal, “For every metric we calculate statistical confidence intervals indicated on our graphs. When confidence intervals overlap, our measured results are too close to declare a winner. In those cases, we show a statistical draw. For this reason, some metrics have multiple operator winners. In our bar graphs we represent confidence intervals as boundaries on either sides of graph bars. In our supporting-metric charts we show confidence intervals as +/- numerical values.”
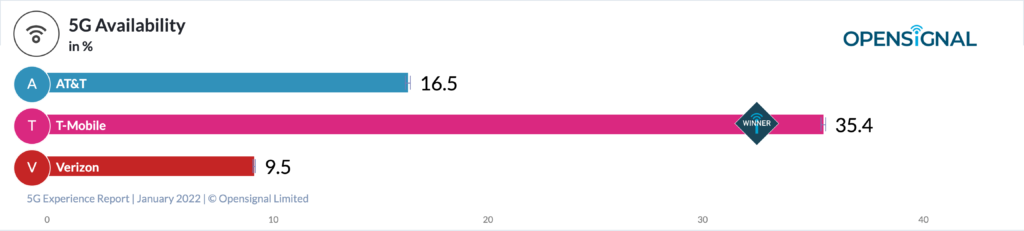
5G Availability
“Opensignal’s 5G Availability compares the amount of time 5G users spent with an active 5G connection — the higher the percentage, the more time that users on a network were actually connected to 5G.”
The brackets |-| represent confidence intervals.
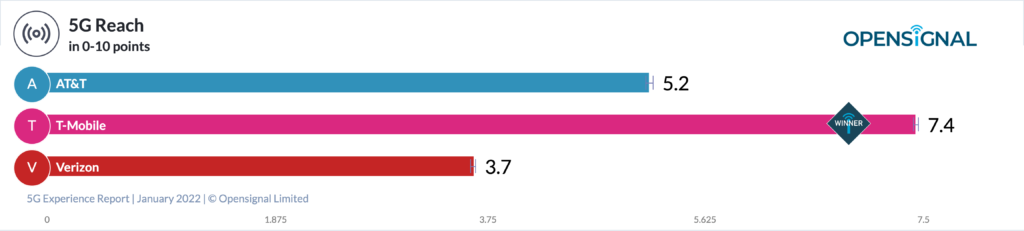
5G Reach
“5G Reach represents the proportion of locations where 5G users have connected to 5G out of all the locations those users have visited, on a scale of 0-10. This measure complements our existing 5G Availability metric, which represents the proportion of time 5G users spent connected to 5G.”
The brackets |-| represent confidence intervals.
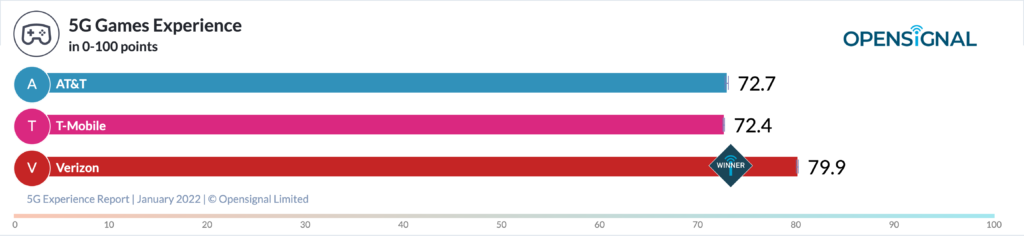
5G Games Experience
“Opensignal’s 5G Games Experience measures how mobile users experience real-time multiplayer mobile gaming on an operator’s 5G network. Measured on a scale of 0-100, it analyzes how the multiplayer mobile gaming experience is affected by mobile network conditions including latency, packet loss and jitter.”
The brackets |-| represent confidence intervals.
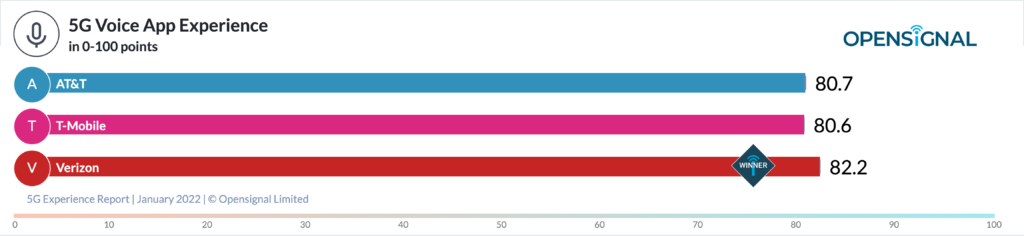
5G Voice App Experience
“Opensignal’s 5G Voice App Experience measures the quality of experience for over-the-top (OTT) voice services — mobile voice apps such as WhatsApp, Skype, Facebook Messenger etc. — when users are connected to a 5G network.”
The brackets |-| represent confidence intervals.
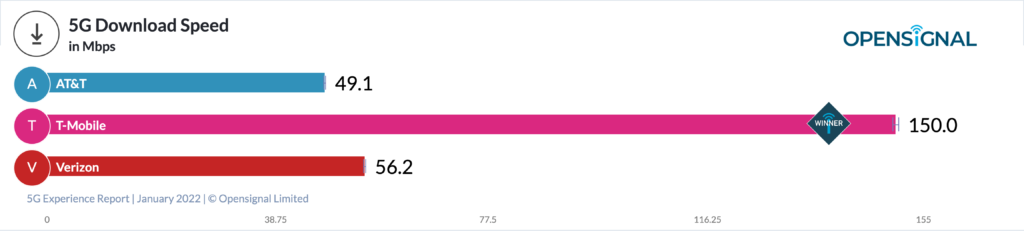
5G Download Speed
“T-Mobile’s 5G Download Speed continues on its upward trend as our users on the carrier now clock average speeds of 150 Mbps, up from 118.7 Mbps in the previous report. A year ago, using T-Mobile our users saw a 5G Download Speed score of 58.1 Mbps, but it has consistently increased since then due to T-Mobile’s ongoing deployment of 2.5 GHz spectrum. The carrier has been increasing both its population coverage, as well as the amount of spectrum deployed on that band.”
The brackets |-| represent confidence intervals.
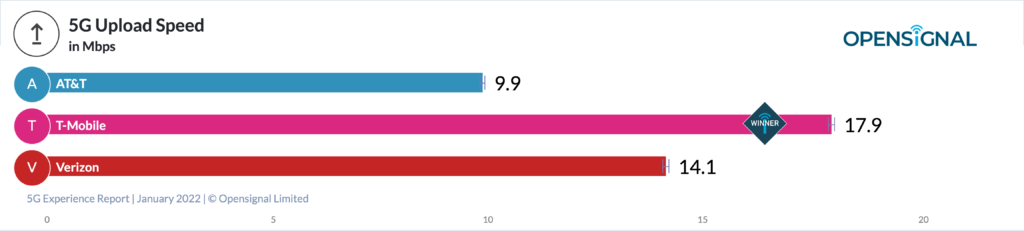
5G Upload Speed
“T-Mobile keeps hold of the 5G Upload Speed award with a score of 17.9 Mbps, which is 1.8 Mbps faster than what our users observed in our October report. Verizon places second in 5G Upload Speed with a score of 14.1 Mbps, which represents a 0.3 Mbps decrease from our previous report, while AT&T’s score increased from 9.7 Mbps to 9.9 Mbps.”
The brackets |-| represent confidence intervals.
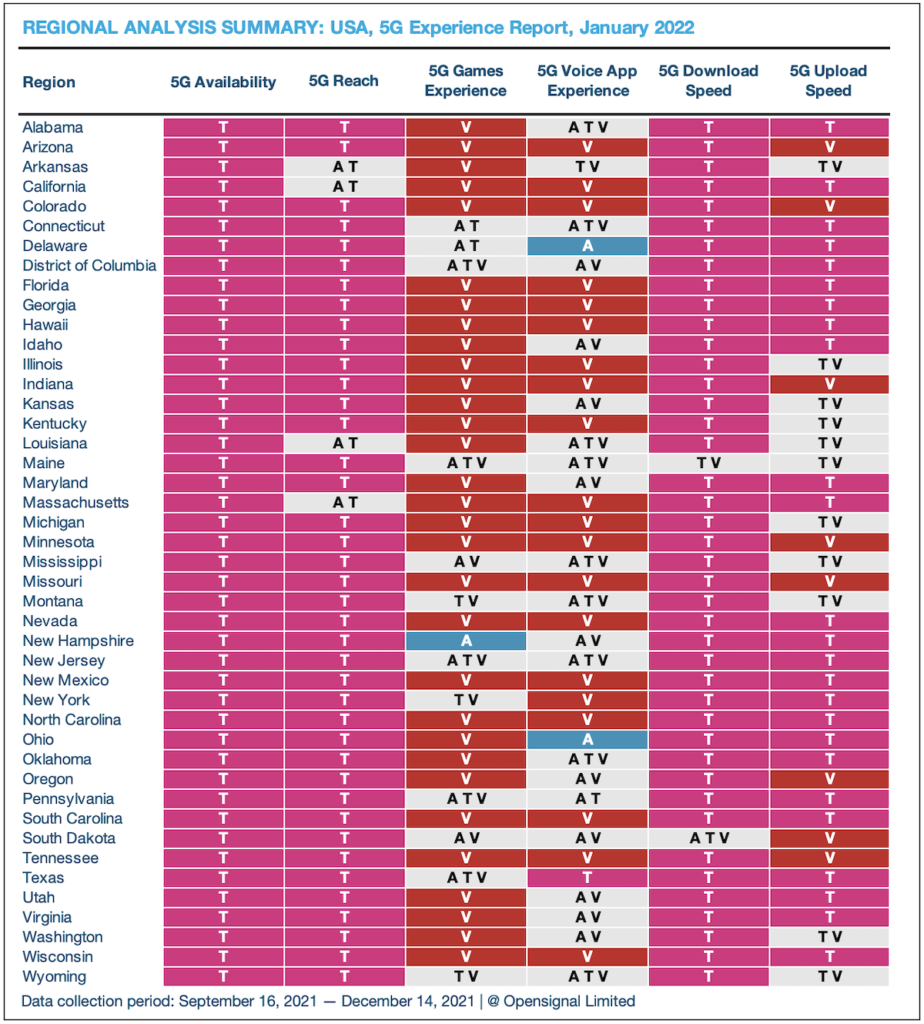
Analysis was also done at the regional level, which you’ll see outlined below.