BELLEVUE, Wash. (T-Mobile Newsroom — Sept. 20, 2022) — Before going interstellar, T-Mobile takes 5G leadership global. In a new global report, leading research firm Opensignal today confirmed that T-Mobile (NASDAQ: TMUS) customers get a 5G signal more often and in more places than anyone else on the planet. That’s right. T-Mobile has the world’s best 5G Availability and 5G Reach … and for the second year in a row was the ONLY U.S. operator to win a 5G Global award!
“The latest awards from Opensignal further prove that our early bets in 5G are paying off for our customers with the biggest, fastest and most reliable 5G in America … and also the best 5G reach and availability anywhere on the planet,” said Neville Ray, President of Technology at T-Mobile. “We’re out in front of the competition, and we’re not looking back.”
This report joins a plethora of others from third-party research firms like Ookla and umlaut, further cementing T-Mobile’s status as the most-awarded 5G network in the nation. In fact, the Un-carrier is the returning champ for best global 5G Availability based on results from Opensignal’s 2021 Global Awards.
For Carrier customers who want to experience a world leader, the Un-carrier’s recently-launched Network Pass gives them free 5G data on T-Mobile’s network for three months using their current compatible phone, so they can see for themselves how T-Mobile performs compared to their current provider.
T-Mobile is the leader in 5G with the country’s largest, fastest and most reliable 5G network. The Un-carrier’s Extended Range 5G covers nearly everyone in the country – 320 million people across 1.8 million square miles. 235 million people nationwide are covered with super-fast Ultra Capacity 5G, and T-Mobile expects to cover 260 million in 2022 and 300 million next year.
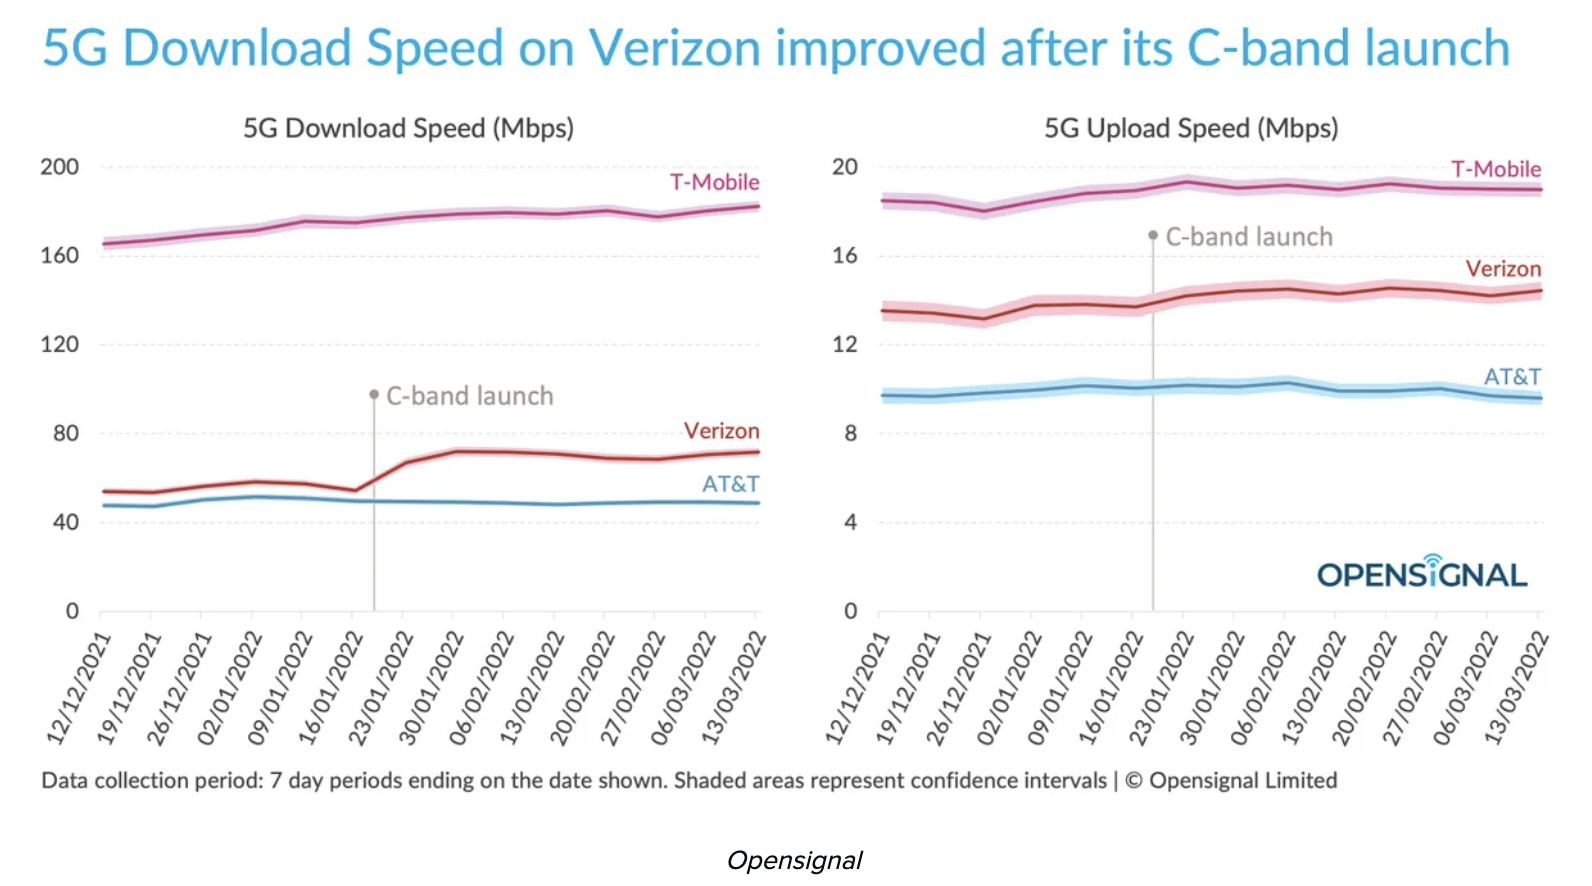
Opensignal has released some findings from tests performed using mid-band services from AT&T, T-Mobile, and Verizon. This is their first major report since AT&T and Verizon launched their first C-band service back in January.
Prior to C-Band coming out, T-Mobile was and still is using its 2.5GHz nationwide 5G network. This was from the spectrum they obtained via the Sprint merger.
Now that the carriers are on more level playing fields, Opensignal determined it was time to put them all to the test. The Opensignal team has measured the impact of each carrier’s C-Band rollout on their nationwide performance within its new Quantifying the impact of C-band on 5G mobile experience in the U.S.
Results show that Verizon Wireless customers came out on top with the initial C-Band rollout. Thanks to the C-band coverage, the carrier’s average nationwide 5G download speed increased by 15Mbps. This spiked from 55.7Mbps shortly before the launch to 70.6Mbps following it. That’s a boost of more than 26% in download rates. Upload speeds on the other hand showed no clear change. Sadly, for AT&T customers, the results before and after the C-band launch were not much different on download or upload speeds.
Opensignal noted that these differences with AT&T and Verizon weren’t exactly surprising. You simply need to compare the rate at which the carriers rolled out service and the number of users they were capable of reaching in this short amount of time. Verizon was able to reach more customers in their rollout than AT&T.
Next, Opensignal measured the head-to-head performance of each carrier’s respective mid-band 5G offering. As you’ll see below, T-Mobile won with the highest download rate. They however lost on the upload rate to Verizon, which came in a close second on download speed.
In their report, Opensignal stressed that, even when limiting its measurements to mid-band connections only, there’s more at work here than raw speed. The company says the other biggest factor is available spectrum ranges and their impact on network capacity. The more spectrum that’s available, the more users can connect before everyone’s download, and upload speeds begin to decline from congestion. It’s helpful to note that both AT&T entered the mid-band 5G game with 40MHz of available spectrum, while Verizon owns 60MHz. Comparatively, T-Mobile is believed to have deployed between 60MHz and 80MHz, with as much as 100MHz available for eventual deployment.
The last item Opensignal looked at were the mid-band download rates of Verizon Wireless and T-Mobile in five major cities: Chicago, Indianapolis, Los Angeles, Minneapolis, and Phoenix. AT&T was purposely left out since their mid-band was only available in Chicago. T-Mobile’s extensive network came out the winner here. It was only a close call when it came to results from Los Angeles.
In conclusion, Opensignal reminded readers that it is still very early days for competitive mid-band 5G in the U.S. However, it already detected average download rates on mid-band 5G that are “much faster — three to four times when connected to mid-band 5G on AT&T and Verizon compared to the average 5G download speeds our users experienced on the two carriers before they activated their C-band networks.”
Thanks to the lead T-Mobile has over the other carriers, they’re likely to stay on top. Although, as Opensignal put it, “data shows that Verizon and soon AT&T now have the required mid-band spectrum to start the chase.”
As 5G is constantly evolving, OpenSignal has released another report regarding the 5G experience across the United States. Per their report, “In this insight we quantify how the 5G experience has changed across the U.S. in the six months since our previous analysis. This benchmark will act as a reference point to evaluate the future impact of AT&T and Verizon’s C-band deployments on the national 5G mobile experience as it records the state of the 5G experience on the eve of the arrival of C-band.”
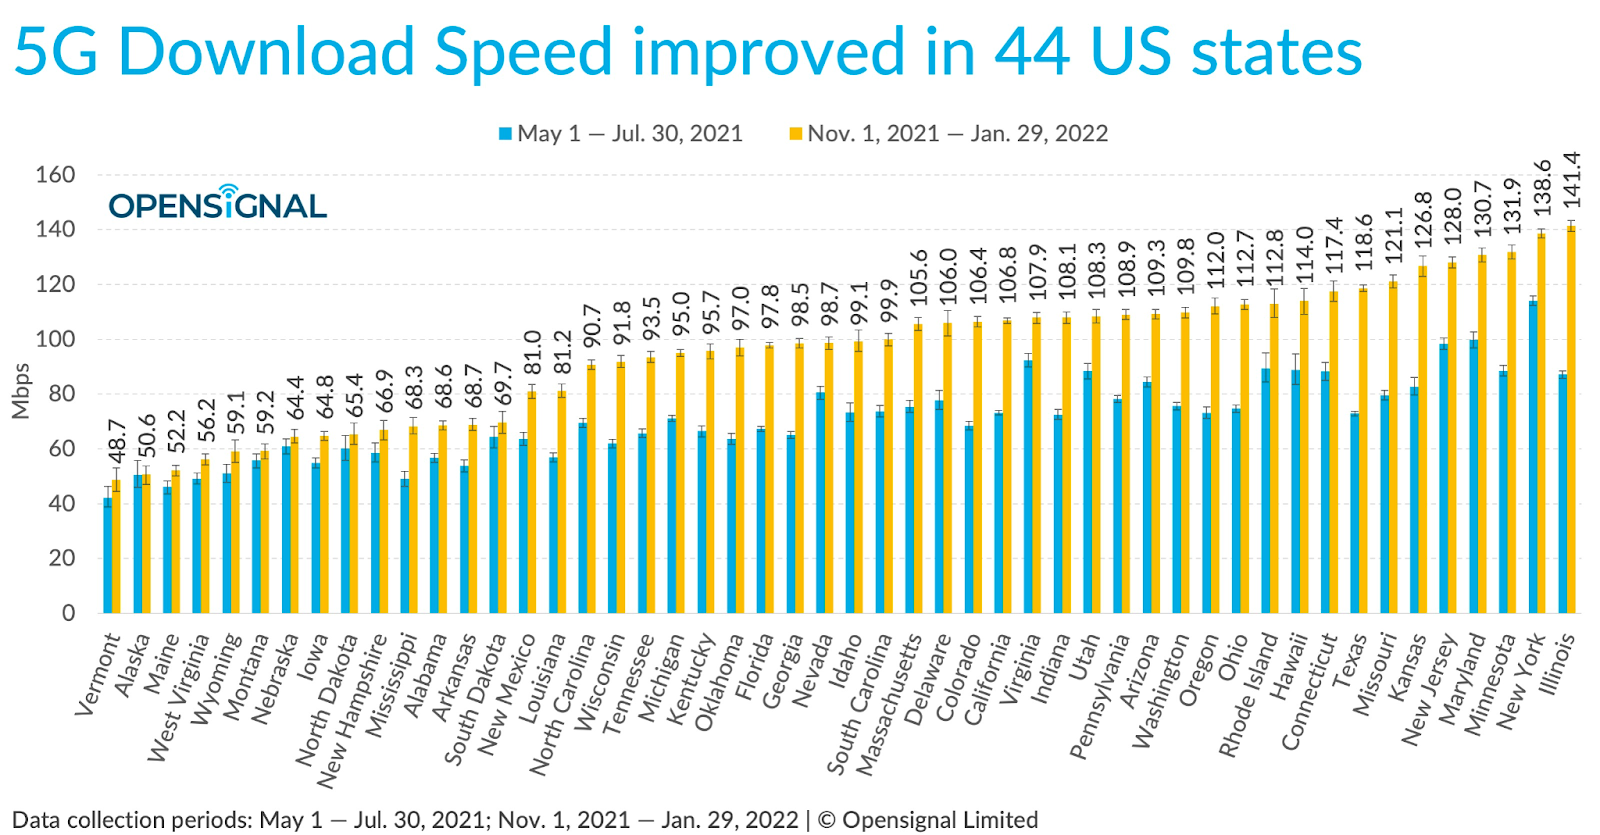
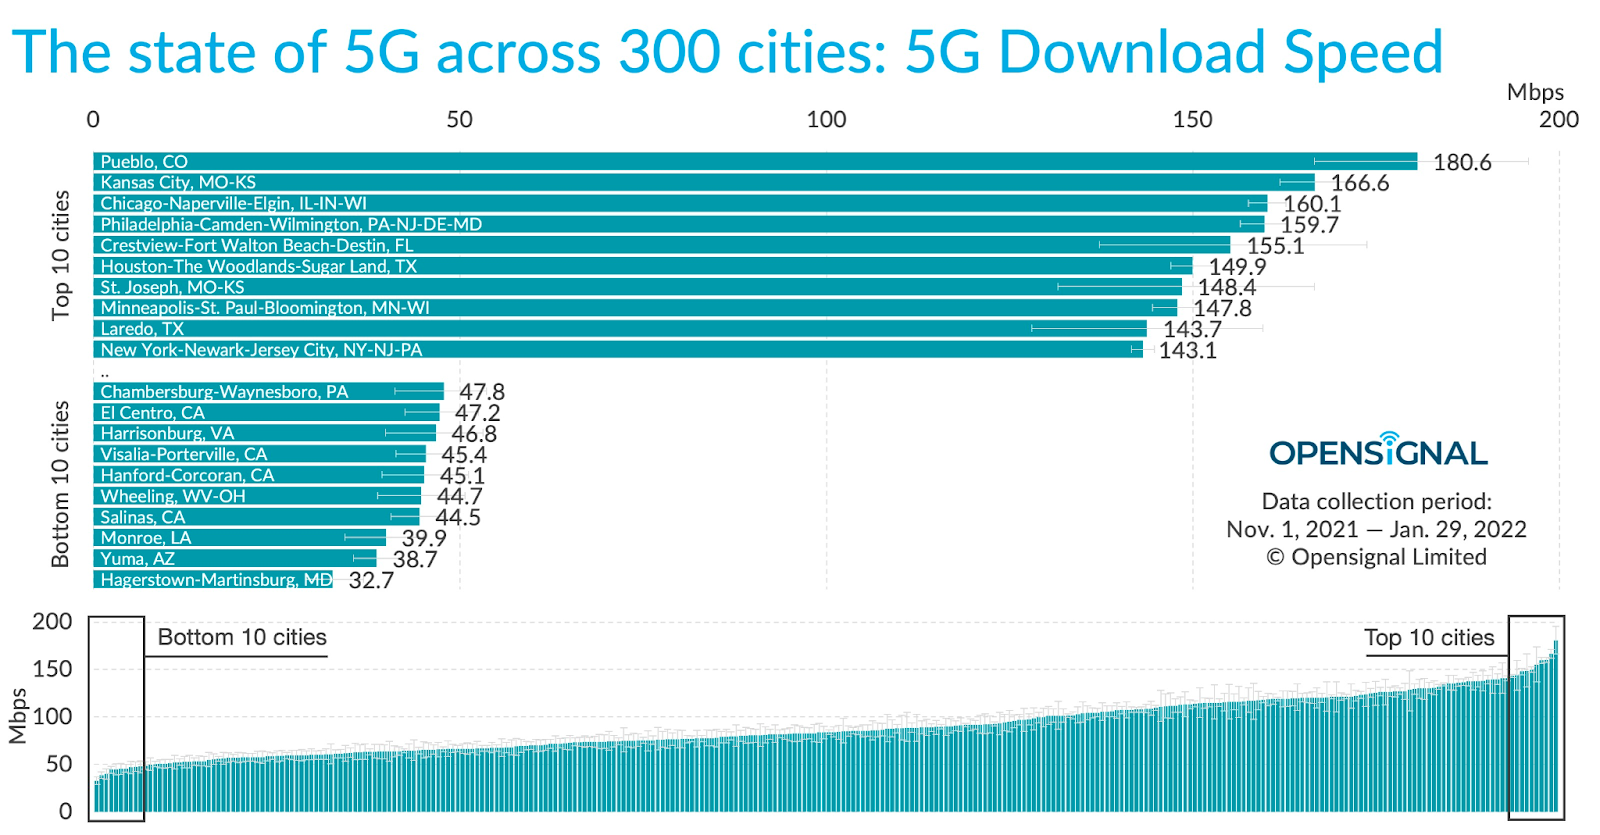
The evaluations were done during a 90-day period, which started on November 1, 2021 and ended on January 29, 2022. This was done across all 50 U.S. states and 300 cities. Among them, Illinois came out on top for download speeds. They had an overall average of 141.4 Mbps, which was just ahead of New York at 138.6 Mbps. In fact, 23 of the states saw averages over 100 Mbps. There were however a few that were under 60 Mbps. Take a look at the results below.
With regards to improvement comparison since the last report, 44 states saw an increase of around 27 Mbps for the average download speed. There were 6 states that saw “no statistical change.”
OpenSignal also looked at the “5G Reach” and how it has improved in each state. The average improvement across the 47 U.S. states that saw their 5G Reach score increase was 17.1% (0.6 points). In this evaluation, all states saw improvement except for Hawaii, North Dakota, and Vermont.
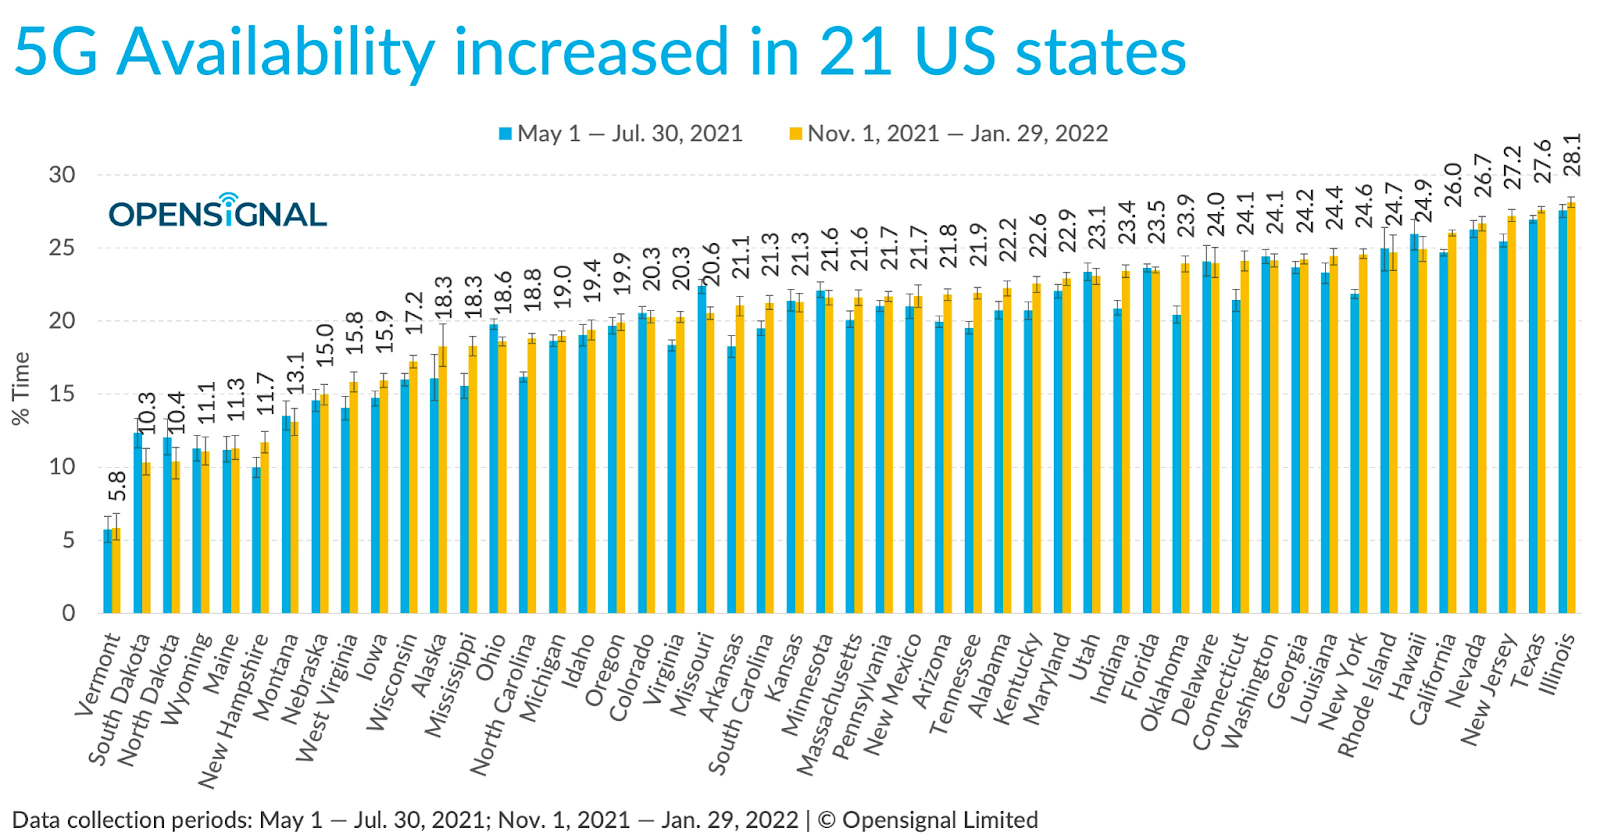
Next, they looked at “5G Availability.” This was increased in only 21 states. “5G Availability represents the proportion of time that 5G users saw an active 5G connection on their smartphone,” states the report.
OpenSignal also reports about the changes that have been made over the course of the past six months that have changed the 5G mobile experience. They see promising signs that U.S. carriers are either planning to or are currently addressing problems surrounding coverage and performance in small rural states.
“For example, our 5G users in West Virginia and New Hampshire saw improvements across all three metrics analyzed — 5G Download Speed, 5G Availability and 5G Reach — meaning that they could access 5G networks in more locations, spend more time with an active 5G connection and also enjoy faster 5G download speeds than before,” says the report. “However, our 5G users in Vermont and North Dakota were the only ones out of the 50 states whose 5G mobile experience hasn’t changed statistically across any of the three measures analyzed, suggesting that 5G improvements are happening at a staggered pace across different locations.”
Lastly, 5G was reviewed across 300 U.S. cities. Specifically, they looked at Availability and Download Speeds. Check out the results below.
Just like 6 months ago, six of the top 10 cities for 5G Availability belonged to Texas. Four of them – McAllen, Brownsville, San Antonio and Waco – also appeared in the previous top 10, while El Paso and Austin made it into the cut this time, replacing Houston and Corpus Christi. The remaining four cities in the top 10 were Chicago, Miami and Los Angeles — all of which were also shortlisted last time — as well as Trenton, New Jersey.
The average 5G download speed passed the 100 Mbps mark in 105 cities, up from 12 last time. Among these cities we found Washington (140.8 Mbps), San Antonio (136.2 Mbps), Los Angeles (134.4 Mbps), Seattle (131.6 Mbps), Phoenix (121.2 Mbps), Dallas (118.9 Mbps), San Diego (118.3 Mbps) and Indianapolis (113.8 Mbps).
OpenSignal is known for its mobile analytics. Each year they release a few reports about the major cellular carriers’ networks. They take results gathered from millions of devices, which result in billions of measurements. The latest data gathered, which was collected between September and December of last year, shows T-Mobile is on top once again.
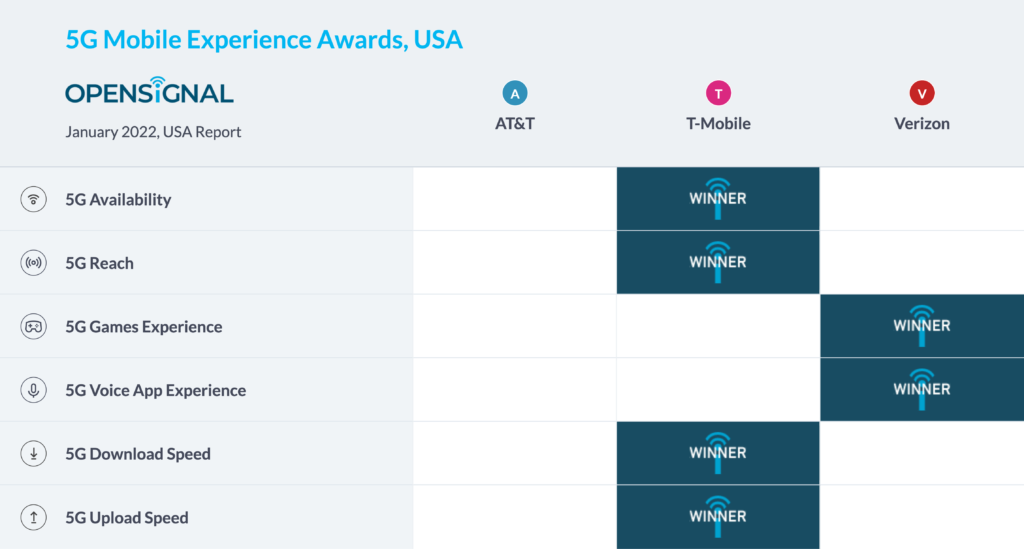
Analysis was done in 43 states, as well as the capital of Washington, D.C., for each of the carriers strictly on their 5G network experience. The report covered: Availability, Reach, Games Experience, Voice App Experience, Download Speed and Upload Speed.
T-Mobile was not the only winner though. Verizon also picked up the categories of Games Experience and Voice App Experience. Sadly, for AT&T, they didn’t win any categories, but still presented good results in comparison to its competitors. It’s no wonder given that T-Mobile has not had to deal with the issues surrounding C-Band that AT&T and Verizon have. This service was originally delayed, then limited to certain locations – all because of possible interference with aircraft tools that also work around the C-Band spectrum.
While Verizon has the best user experience, T-Mobile dominates the speed categories. In fact, they’ve been at the top of the Download Speed category for six times in a row and Upload Speeds for the fifth time in a row.
T-Mobile also won the Availability and Reach categories. It’s clear their lead on getting mid-band service out to 200 million users was a success. This is what they have dubbed their “Ultra Capacity 5G” service. It relies on the 2.5 Ghz band, so it is unaffected by the FAA concerns that have affected the C-Band.
Now let’s take a closer look at how all the carriers fared in each category, at the National Analysis level.
Note that each of the OpenSignal charts listed below have brackets at the end of their respective graphs. These brackets represent confidence intervals. Per OpenSignal, “For every metric we calculate statistical confidence intervals indicated on our graphs. When confidence intervals overlap, our measured results are too close to declare a winner. In those cases, we show a statistical draw. For this reason, some metrics have multiple operator winners. In our bar graphs we represent confidence intervals as boundaries on either sides of graph bars. In our supporting-metric charts we show confidence intervals as +/- numerical values.”
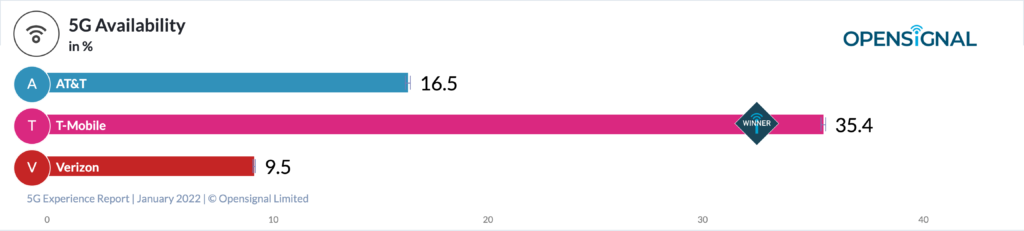
5G Availability
“Opensignal’s 5G Availability compares the amount of time 5G users spent with an active 5G connection — the higher the percentage, the more time that users on a network were actually connected to 5G.”
The brackets |-| represent confidence intervals.
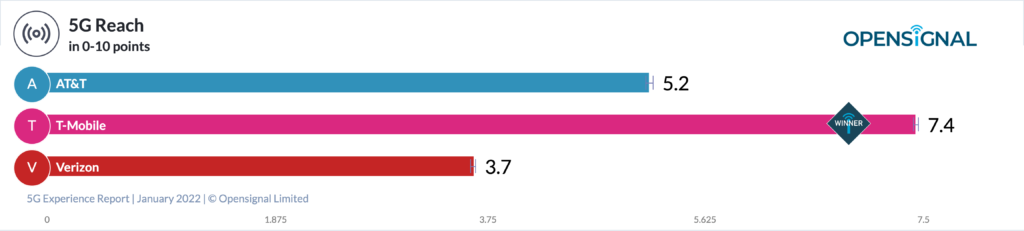
5G Reach
“5G Reach represents the proportion of locations where 5G users have connected to 5G out of all the locations those users have visited, on a scale of 0-10. This measure complements our existing 5G Availability metric, which represents the proportion of time 5G users spent connected to 5G.”
The brackets |-| represent confidence intervals.
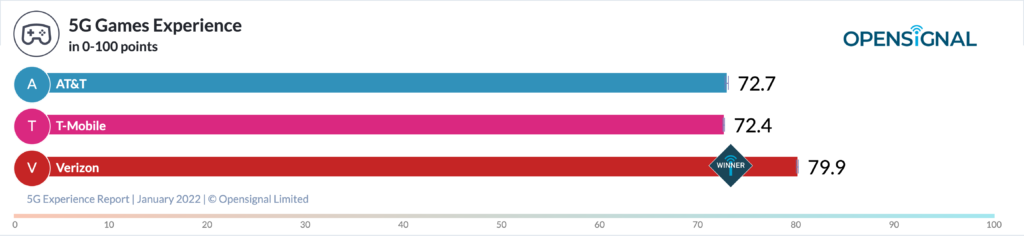
5G Games Experience
“Opensignal’s 5G Games Experience measures how mobile users experience real-time multiplayer mobile gaming on an operator’s 5G network. Measured on a scale of 0-100, it analyzes how the multiplayer mobile gaming experience is affected by mobile network conditions including latency, packet loss and jitter.”
The brackets |-| represent confidence intervals.
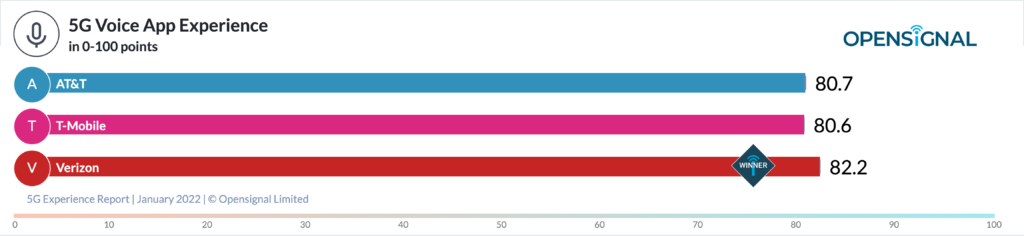
5G Voice App Experience
“Opensignal’s 5G Voice App Experience measures the quality of experience for over-the-top (OTT) voice services — mobile voice apps such as WhatsApp, Skype, Facebook Messenger etc. — when users are connected to a 5G network.”
The brackets |-| represent confidence intervals.
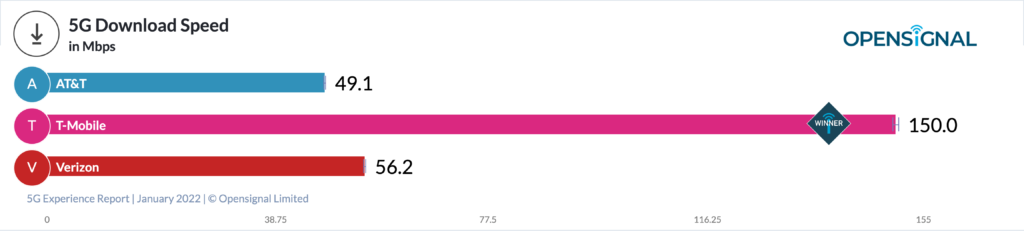
5G Download Speed
“T-Mobile’s 5G Download Speed continues on its upward trend as our users on the carrier now clock average speeds of 150 Mbps, up from 118.7 Mbps in the previous report. A year ago, using T-Mobile our users saw a 5G Download Speed score of 58.1 Mbps, but it has consistently increased since then due to T-Mobile’s ongoing deployment of 2.5 GHz spectrum. The carrier has been increasing both its population coverage, as well as the amount of spectrum deployed on that band.”
The brackets |-| represent confidence intervals.
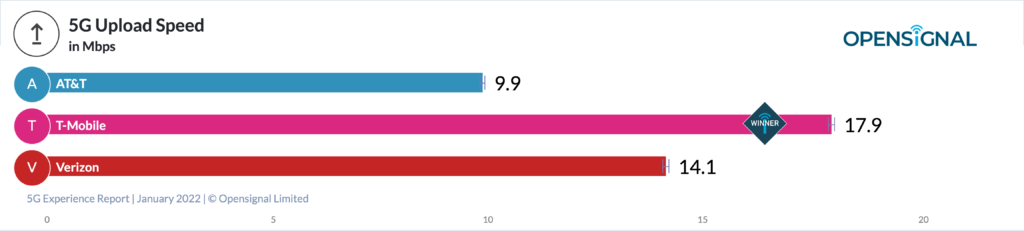
5G Upload Speed
“T-Mobile keeps hold of the 5G Upload Speed award with a score of 17.9 Mbps, which is 1.8 Mbps faster than what our users observed in our October report. Verizon places second in 5G Upload Speed with a score of 14.1 Mbps, which represents a 0.3 Mbps decrease from our previous report, while AT&T’s score increased from 9.7 Mbps to 9.9 Mbps.”
The brackets |-| represent confidence intervals.
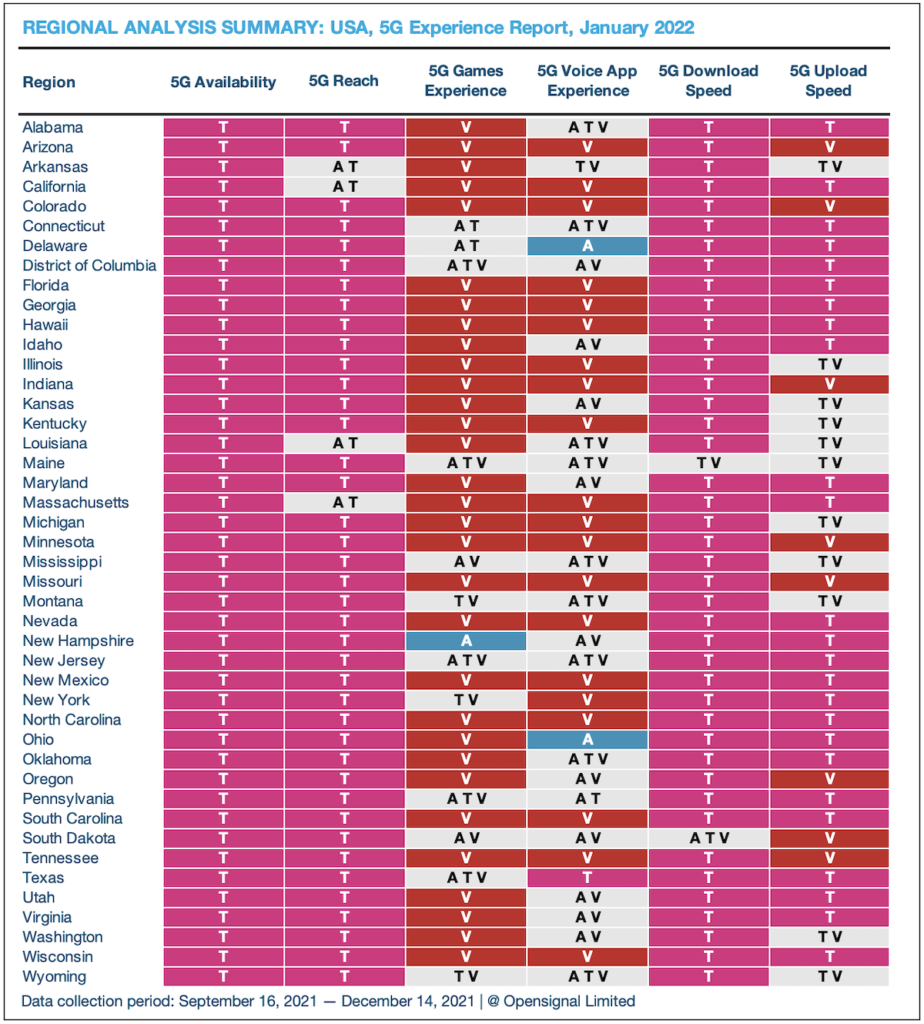
Analysis was also done at the regional level, which you’ll see outlined below.
That is the question indeed, on many of our minds! Much like the confusion around AT&T and T-Mobile’s 4G HSPA+ – an update to 3G, but not quite comparable to LTE performance – carriers are leading customers to believe they’ll be getting all that 5G service has been promising – faster speeds and lower latency. However, that’s not quite the case. 5G operates on many different bands, some of which are simply repurposed from LTE. This makes it typically better than LTE, but not quite at the level of 5G (or at least our perceptions of what it should be).
So what about the coverage maps showing 5G service? And your phone says 5G sometimes, right? Here’s what that can mean…
5G running on Low Band spectrum is the slowest, but it has the advantage of considerable range
Mid-band can’t travel as far, but is faster
High Band spectrum, which is sparsely available, may travel only a mile but is by far the fastest.
An analysis done by OpenSignal released last week found that their testers connected with T-Mobile 5G just 34.7% of the time, AT&T 16.4% of the time and Verizon just 9.7%. And that’s generally not for the fastest 5G service.
In comparison, the numbers shown have quite a significant difference to what the carriers promise about 5G in their advertisements. This just goes to show you that not everything advertised is in fact true. Carriers admit they are still working on their 5G networks and that there is quite a bit of “dishonesty in advertising.” Still, we can see in the fine print how they manage to get away with it. Though, you wonder for how long?
National Advertising Division – a division of the independent non-profit organization BBB National Program – has criticized claims made about 5G by all three of the companies. “5G right now is (in) the fake it until you make it stage,” said Harold Feld, of advocacy group Public Knowledge which promotes affordable communication, adding that when new technology is developed, advertising often gets ahead of actual deployment.