Boosting Cellular Connection Speeds: How Antennas Can Help Improve Bandwidth

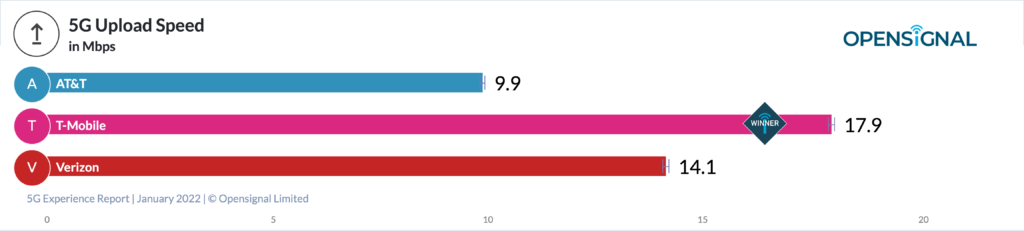
As more of our lives depend on technology and the Internet, it’s important that we have a fast and reliable connection. For wired Internet services, that might not be such a problem. What if you’re relying on mobile broadband Internet service? With the advent of 5G technology, cellular networks have become even faster, offering lightning-fast download and upload speeds to users. However, there are still many areas where cellular connectivity is weak, and users struggle to get high-speed internet.

In order for the cellular service to provide an adequate connection, the cellular device must have a decent signal. There may be good bandwidth speeds too, but both cellular signal strength and bandwidth speeds are quite variable. This is due to differences in things like environment and the frequency in which the cellular connection is broadcasting. So, we recommend users perform a site survey at their location to help determine if an antenna may help. Of course, in some cases users may opt instead for a wireless signal repeater/booster. These come as kits that are made for boosting signals to multiple cellular devices simultaneously.  

An antenna is a device that is designed to transmit and receive electromagnetic waves. In the context of cellular networks, antennas are used to capture signals from nearby cell towers and transmit them to the user’s device. They also send signals from the user’s device back to the cell tower. By using a high-quality antenna, users can improve their signal strength and achieve higher speeds. Want to see how it works? Check out our video below. 

What Affects Cellular Performance?

In cellular networks, the antenna is a critical component that determines not only the signal strength, but coverage area and data rate of the wireless link. The signal strength is a measure of the power of the received signal at the receiver’s antenna. The coverage area is the region around the cell tower where the signal strength is sufficient to maintain a reliable connection with the user’s device. The data rate is the maximum achievable speed of data transfer between the user’s device and the cell tower.

Several factors affect the performance of the antenna in cellular networks. One of the primary factors is the distance between the user’s device and the cell tower. The farther away the user’s device is from the cell tower, the weaker the signal strength, and the lower the data rate. This is because the electromagnetic waves from the cell tower follow an inverse-square law, which means that the power of the signal decreases with the square of the distance from the source.

Another factor that affects the antenna’s performance is the obstructions between the user’s device and the cell tower. Obstructions can be natural, such as trees, hills, and mountains, or artificial, such as buildings, walls, and vehicles. Obstructions can cause attenuation, reflection, and scattering of the electromagnetic waves, leading to a decrease in signal strength and data rate.

Interference is another factor that affects the performance of the antenna in cellular networks. It can be caused by other wireless devices operating in the same frequency band or by noise sources such as motors, generators, and power lines. Degradation in the the signal quality, increases in the error rate, and reductions in the data rate can also be possible.

Types of Antennas

There are several types of antennas that can be used to improve cellular speeds. Each have its own set of advantages and disadvantages. Some of the most common types of antennas used in cellular networks include:

  • Omnidirectional Antennas: These are the most common type of antenna used in cellular networks. Omnidirectional antennas transmit and receive signals in all directions, making them ideal for use in areas where there are multiple cell towers or where the user’s device is moving around.
  • Directional Antennas: As the name suggests, directional antennas transmit and receive signals in a specific direction. These antennas are ideal for use in areas where there is only one cell tower or where the user’s device is stationary.
  • Yagi Antennas: Yagi antennas are a type of directional antenna that is designed to provide high gain and long-range coverage. These antennas work best where there is line of sight to the cell tower, meaning little to no obstructions in between. They are often used in more remote areas where there is a weak signal and speed.
  • Panel Antennas: Panel antennas are another type of directional antenna that is designed to provide high gain and long-range coverage. These antennas do not require line of sight and are also used in more rural areas.

What Can You Do?

To overcome challenges, and improve the performance of the antenna in cellular networks, several techniques and technologies have been developed. One of the most effective ways to improve the antenna’s performance is to use a high-quality antenna. Specifically, one that is optimized for the specific frequency band and radiation pattern. For example, some directional antennas are tuned to a specific frequency. This generally results in a higher boost than antennas with wider frequency ranges. 

Another technique to improve the antenna’s performance is to use multiple antennas in a system, known as Multiple-Input Multiple-Output (MIMO). MIMO technology allows the user’s device to transmit and receive multiple data streams simultaneously using several antennas. This can increase the data rate and reliability of the wireless link. It is commonly used in modern cellular networks to achieve high-speed internet connectivity and support advanced applications. Things like video streaming, gaming, and virtual reality.

Using an antenna to improve cellular speeds is relatively easy, and most cellular modem/ routers come with external antenna ports. Users can purchase a high-quality antenna that is compatible with their device and if needed, connect it using an adapter. Once connected, the antenna will begin capturing signals from nearby cell towers. It then transmits them to the user’s device, resulting in improved connectivity. 

If you’re ready to see how an antenna can help you, check out our guide to selecting the right antenna. The 5Gstore team is also ready to assist you with any questions, Monday thru Friday. Reach us by phone, email, or chat!

OpenSignal Reports: Who is the Best Cellular Provider?

OpenSignal has released their collection of data from cellular providers over the dates of September 16 to December 14 of 2022. It will be no surprise to some of us that in these cellular reports, T-Mobile has won out above the rest, yet again. 

On the mobile network experience report, multiple factors were tested. For overall experience, the cellular report included video, games, voice app, download speed, and upload speed. For coverage, they checked availability across the providers. Lastly, they checked for consistency in excellent quality and core quality. 

Experience and coverage might make sense, but what about consistency? Per OpenSignal, “Consistent Quality measures how often users’ experience on a network was sufficient to support common applications’ requirements. It measures download speed, upload speed, latency, jitter, packet loss, time to first byte and the percentage of tests attempted which did not succeed due to a connectivity issue on either the download or server response component.”

Core Consistent Quality represents common, but less demanding use cases such as SD video streaming, web browsing, and email use. Excellent Consistent Quality is designed for higher quality applications such as live video streaming and streaming video games. See how Consistent quality metrics are calculated here.

The only awards that T-Mobile did not take was in the Availability section. That award goes to the previous champion, AT&T. AT&T and Verizon were only 0.2 percentage points away from each other. T-Mobile came up last with a score of 98%.

OpenSignal’s 5G Experience Report awards were a bit of a toss up between Verizon and T-Mobile. The UnCarrier took a slight lead by winning in 4 categories (download and upload speeds, as well as availability and reach), versus Verizon’s 3 (Video, Games, and Voice app experiences). Much like the mobile network experience report, the 5G cellular report tests the same categories, but with 5G specifically, and less the consistency awards. Instead, in coverage, they checked both availability and reach.

Experience awards were all quite close, with Verizon just barely winning out over T-Mobile. The only exception being 5G download speeds. T-Mobile was the clear winner here, topping out at 186.3 Mbps versus 84.9 Mbps from Verizon and 71.1 Mbps from AT&T. Regarding coverage and 5G Availability, T-Mobile won again with a far lead of 30% over its closest competitor, AT&T. 

Per OpenSignal, “5G Reach measures the 5G mobile experience in all the locations that matter most to everyday users – i.e. all the places where they live, work and travel. 5G Reach for each operator is measured on a scale from 0 to 10.” The results were a bit closer on this one. With a score of 8.3, T-Mobile had a little over a 2 point lead ahead of AT&T and about 4 points from Verizon.  

Something to keep in mind when reviewing the results for yourself – tests were done at the national and regional level. While T-Mobile may be the majority winner, take note of the winners in your state. You may find a different provider is more appropriate.

How Do I Perform a Cellular Site Survey?

When it comes to boosting cellular signal, it can be extremely helpful to perform a site survey. This is a simple cellular network strength test of signal and bandwidth.

Verifying where you have the best signal and bandwidth speeds first, will not only help determine the ideal placement for your external antenna, but that there is enough available signal to increase network performance. Even the best outdoor antenna or amplifier kit can only increase your signal if there is a signal available to draw in. On the other hand, if your signal is already strong, a signal booster might not provide enough benefit to be cost effective.

While this is mainly done for fixed applications. such as at your home or business. You may also do this if you’re traveling and planning to stay in the same location for an extended period. 

There are tools like the SureCall Site Survey kit which is made specifically for testing signal strength. However, unless you need an easy way to test multiple carrier signals, a cell phone or cellular modem can be sufficient. Cell phones will, of course, be limited to only the carrier they are linked to. Though if you have a cellular modem – Peplink, Cradlepoint, Digi, Inseego, Sierra Wireless, etc – you can test any carrier for which you have an active SIM card. 

Before you get started, it’s important you understand the data you’re looking for. RSSI, (Received Signal Strength Indicator), as well as RSRP (Reference Signal Received Power). These are both values that measure signal strength. RSRP is what you will want to refer to when looking at LTE and 5G signals. These signal values will be represented as a negative number. The closer this number is to 0, the stronger the signal strength. 

Also note the RSRQ (Received Signal Received Quality) and SINR (Signal to Noise Ratio). These values are what you’ll refer to for the signal quality of LTE and 5G connections. The SINR value will be the only value that is a positive number. Not all modems will list this value.  

Each of these values varies for different technologies and carriers as they depend on the particular abilities of the modem – essentially how well it can extract a signal. The values shown in the charts here are what we typically reference. 

We cannot guarantee a particular signal or improved performance, regardless of the signal strength and quality.  This is because of the many factors which affect signal values. Such as:

  • Distance to the cell tower.
  • Tower load.
  • Physical barriers (mountains, buildings, trains, etc).
  • Competing signals.
  • Signal from a cellular booster.
  • Weather.  

Unfortunately, there is no clear cut answer to what constitutes a successful connection. It is possible to disconnect with excellent, as well as poor values. You have to take both signal strength and signal quality into account. You could have an excellent signal, but disconnect because of poor quality. And vice versa. You may also stay connected because of good signal, but have poor bandwidth speeds because of poor signal quality. 

The variance of a signal is a significant factor in the success of a connection. Measurements of signal strength and signal quality for a specific moment do not reflect on the stability of a connection, as these values will vary as conditions change. 

Some factors, like cell tower load, can’t even be measured. You can only gain some idea as to whether or not tower load affects your connection by testing at different times of day. This allows you to find averages, but also helps to confirm if you’ll see any improvement when the tower is at full load.  

We understand that finding RSRP and RSRQ on a cell phone could be a bit tricky compared to cellular modems and routers. Some phones will only list RSRP. In the event you cannot locate these specific values from your cellular device, doing a site survey using the signal bars as a reference is fine. At a minimum, the signal bars will give you some data to compare with. It’s also best if you can perform speed tests in multiple points at the location. This can help determine if bandwidth performance improves. Especially when you’re not seeing a change in signal bars. 

To perform the site survey, try to answer the following, as best you can.

  • What is the RSRP indoors, at the location you use your device?
  • At that location, what are your speeds? You can use a site like speedtest.net to check your download and upload speeds.
  • What is the best RSRP you could find immediately outside and around the building?
  • At that location outside, what are your speed test results?
  • If the signal outside the building is not significantly better than it is inside, walk or drive in the direction of a better signal until you find a significantly better signal. At that location, what are your speedtest results?
  • What’s between you and that optimal signal? Trees? Elevation? How far away is it?  

For your reference, you can find instructions for locating your RSRP and RSRQ/ SINR on the Apple iPhone, Samsung, Google, Blackberry, and Nokia phones here.  

For different router instructions, check out our YouTube Channel.

If you have more questions, or would like assistance determining if an antenna or amplifier system can help you, reach out to our team by phone, email, or chat!

How Important is Latency to 5G Users?

According to Ericsson, user experience is all about “time-to-content” – in other words, how fast does my video start or my webpage load after I click to open it? Based on a study the company recently conducted, they found that latency is rarely a factor when it comes to user satisfaction. 

Reiner Ludwig, Strategic Product Manager in the Business Area Networks at Ericsson wrote a blog on just this – “Latency hardly impacts smartphone user experience in advanced 5G and 4G networks.”

In describing the study, Ludwig says they used high-end smartphones in a controlled environment. These were all requesting popular content (YouTube, Instagram, Amazon, eBay, Uber, etc) in an automated way. 

“For the latency measurements, we have ensured that sufficient up- and download speeds were available to the devices at all times: an uplink throughput “at click” of at least 1 Mbps and a downlink throughput “at click” of at least 20 Mbps,” he said. 

Tools and guidelines for the study were provided by Google on web.dev. This allowed them to see the relationship between time-to-content and latency, and time-to-content and up- and download speeds.

What is Latency?

Ludwig describes latency as the time it takes for a device to send one small ‘echo’ packet to the serving content server and the corresponding ‘echo-reply’ packet to return to the device. This period of time is also called the round-trip time. 

What isn’t latency? It’s NOT the same as time-to-content. This is where many people tend to misunderstand. 

Where is Low Latency Most Helpful? 

While low latency is important to online gamers, it’s more crucial for machines. 

“Machines, not humans, can benefit from the ultra-low and ultra-reliable latencies that only 5G can provide. For example, think about video-controlled high-precision robots in a smart factory. Here, you might see latencies below 10 ms, i.e., ultra-low, and without latency spikes exceeding 10 ms, i.e., ultra-reliable. Meeting these tough requirements is one of the key drivers behind Ericsson’s launch of a new product offering targeted at Time-Critical Communication,” says Ludwig.

Surprisingly, us humans are hardly able to tell the difference between 30 and 50ms of latency. Ludwig explains that 5G and 4G latency in the U.S. is usually less than 50 ms. This came from a 6 month analysis of Ookla’s speed test results, which were gathered from all across the U.S.

The takeaway here is that 5G (human) user experience is determined by speed, not much by latency. However, Ludwig admits, “Once 5G use cases such as virtual and augmented reality become mainstream, some aspects might need to be revisited.”

To view Ludwig’s blog in its entirety, see here.


What is the Current 5G Experience in the U.S?

Over the course of 3 months (Mar 16 – Jun 13, 2022), OpenSignal gathered 5G data points from each of the major U.S. cellular carriers – Verizon, AT&T, and T-Mobile. This data was put into a report they call the 5G Experience Report, and it was just released. Big surprise…it shows T-Mobile as the winner in most categories. Check out the overall results below.

Taking a closer look, each category was analyzed at the national and regional levels. T-Mobile won with Download speeds over 98Mbps faster than Verizon and AT&T. Overall, the total was 171Mbps. This is T-Mobile’s sixth win in a row. The Upload speed tests were a bit closer, with only a 3Mbps difference between T-Mobile and Verizon. T-Mobile’s total was 17.8Mbps, and again, this was their sixth time in a row to win this category. Verizon and AT&T customers may still want to be hopeful though. They are the only two carriers that are using C-Band deployments. As these deployments increase, we suspect these reports may change. Still, T-Mobile has quite a lead.

Not only do T-Mobile customers receive the best overall speeds, but they can also access them in more places than other carriers’ networks. OpenSignal confirms this by awarding T-Mobile with the best 5G Reach. The report also confirms that T-Mobile has the best 5G Availability. It shows that T-Mobile customers were connected to 5G 2 times more often than AT&T customers, and over 3 times more often than Verizon customers.

With regards to testing 5G Games experience and Voice App experience, the point scale was 0 to 100. This is where Verizon won out against the others, but all were within a small margin. 

According to OpenSignal, “a good Games experience means that the gameplay experience was generally controllable and users received immediate feedback between their actions and the outcomes in the game. Most users did not experience a delay between their actions and the game.”

You may also be wondering what qualifies a good 5G Voice App Experience too. These tests “quantify the experience of Opensignal users when using over-the-top voice apps — such as WhatsApp, Skype and Facebook Messenger — on an operator’s 5G network. It uses a model derived from the International Telecommunication Union (ITU) approach for quantifying overall voice call quality and a series of calibrated technical parameters. This model characterizes the exact relationship between the technical measurements and perceived call quality.”

Want to know more about OpenSignal’s metrics and what they mean? Check out their article here.

Who Has the Best Mobile Network?

T-Mobile does it for the second year in a row – they’ve beat out Verizon and AT&T in recent tests performed by the PCMag team. They’ve been running these “Fastest Mobile Network” tests for the past 12 years and with this year came some changes. They opted for electric vehicles for the more than 10,000 mile drive across the country. They used new software that tracks dropped calls and provides a better measure of reliability. Also, while previous years were in search of America’s fastest mobile network, they are now on the search for the best network. 

Using the Samsung Galaxy S22+ phone, the team stopped in 30 cities and six rural regions where they compared performance between AT&T, T-Mobile, and Verizon. Of these 30 cities, T-Mobile won in 18, Verizon won in eight and AT&T won in four. According to the team, “We use people, not square miles, to determine our scores. Rural areas comprise 16% of our score, similar to the 14-20% of the US population classified as rural.”

The reason for using the Samsung Galaxy over other 5G phones? PCMag said, “We’re using the Samsung Galaxy S22+ because it has shown the best network performance in our tests. With its Qualcomm X65 modem, the S22+ can hold onto weak signals longer than phones from previous years, and it supports all the new 5G bands carriers are implementing, including the frequencies AT&T is launching later this year.”

Due to the new software used this time around, the results aren’t directly comparable to those from previous years. For example, both T-Mobile and Verizon see dramatically increased nationwide speeds this year as they expand their mid-band 5G networks. However, as AT&T’s speeds decline, it has added very little capacity while data demands grew.

Looking closer at those speed results, T-Mobile also won here, specifically in upload and download speeds. The carrier was the fastest in 19 cities out of 30, compared to Verizon with nine and AT&T with two. PCMag also reported that T-Mobile is performing better in rural areas, but explained that it still has more rural dead zones in the Northeast than Verizon and AT&T do.

So how exactly is it that T-Mobile was capable of these wins? Their mid-band 5G network. This is what the carrier built from Sprint’s network after acquiring the company for $26 billion in 2020. They’ve also begun using carrier aggregation within the mid-band network to achieve faster speeds. 

For Verizon and AT&T, they are still working on closing the gap by utilizing mid-band spectrum they obtained in a recent FCC auction. Verizon has already gotten started with its 5G network, but AT&T has been waiting for the equipment required to build it out. AT&T hopes to have more 5G network service up and running by next year.

Does T-Mobile Still Have the Fastest 5G?

You may be familiar with Ookla, or their famous speedtest.net website that lets users easily test their Internet connection’s latency and download and upload speeds. They also run quarterly reports comparing the results between different Internet providers, both fixed and mobile. 

We’d like to highlight the mobile results only. This first quarter’s results were just released Monday and they compare median download speed, median latency, consistency score, and availability. 

Results reveal T-Mobile is still in the lead, and at the top of each category tested. The only change is that the gap between T-Mobile and Verizon has lessened. Here are just some results; median download speeds:

  1. T-Mobile: 191.12Mbps (up from 187.12Mbps)
  2. Verizon: 107.25Mbps (up from 78.52Mbps)
  3. AT&T: 68.43Mbps (down from 68.82Mbps)

With regards to testing by state and city, Minnesota took the top spot for fastest median mobile download speed during Q1 2022 at 92.31 Mbps. Overall, T-Mobile was the fastest mobile provider in 42 states. Results were too close to call in 6 states. 

St. Paul, Minnesota had the fastest median mobile download speed among the 100 most populous cities in the U.S. Speeds topped out at 136.72 Mbps. T-Mobile was the fastest operator in 78 of these cities. Verizon Wireless was the fastest provider in 10 cities, and US Cellular was fastest in one city (Madison, WI). The results were statistically too close to call in 11 cities.

Per T-Mobile news, their President of Technology has this to say about today’s win: 

“Our 5G network is delivering a powerful performance boost and it’s resonating, with over 40% of our customers now using a 5G device, accounting for more than HALF of our network traffic. And we’re just getting started – this leading network experience will continue to improve as we accelerate our 5G build this year and beyond.”

Who is the fastest 5G carrier in the US?

According to the latest report from RootMetrics T-Mobile may have the fastest 5G speeds and greatest 5G availability, but what about reliability?

When measuring only 5G reliability, a different carrier, Verizon, came out on top.

The timing of this testing however, is important to note. 5G performance was done during the second half of 2021. At the start of the New Year, you may recall that Verizon and AT&T were finally able to turn on their new C-Band 5G coverare, which brings faster average speeds to a greater number of people (more than 90 million, according to Verizon). AT&T has only a handful of cities covered at this point.

The RootMetrics report gathered results from tests that were run in 125 of the largest cities in the U.S. In the end, they found T-Mobile had the fastest 5G download speeds in 48 markets, compared to three for Verizon and zero for AT&T. Median download speeds for T-Mobile topped 100 Mbps in more than half the cities RootMetrics tested in. In 26 markets, the speeds topped 200 Mbps.

T-Mobile was also determined to have the best 5G availability. With the highest availability in 83 tested markets, T-Mobile topped AT&T (62 markets) and Verizon (6 markets).

In comparison with 5G reliability, T-Mobile was actually found to have the lowest amount at 19. Verizon had the best in 93 markets, also topping AT&T, which only showed in 67 markets. 

These findings weren’t just determined by RootMetrics either. Their results are right inline with what has been seen from other third party testers. Back in January, OpenSignal published a 5G performance report in which T-Mobile not only had the fastest 5g download speeds, but was 93.9 Mbps faster than its closest rival. T-Mobile also came out on top for availability and reach.

When comparing T-Mobile’s approach to the 5G rollout to that of AT&T and Verizon’s, it’s clear that T-Mobile got ahead by using sub-6GHz spectrum to create a far-reaching 5G nationwide network. The network now reaches more than 310 million people. More recently, they’ve begun using mid-band spectrum — much of it obtained through the merger with Sprint — to boost speeds. T-Mobile calls this their Ultra Capacity 5G service and it covers some 210 million people.

Verizon and AT&T started their 5G journey by concentrating on mmWave-based 5G. This can be very fast, but has a limited range. mmWave-based towers are in select cities. To provide more coverage, but at slower speed, the two carriers use sub-6GHz 5G.

After a few delays and limitations AT&T and Verizon were able to roll out more coverage in January, this time on the faster C-Band spectrum. The higher band spectrum has a wider reach than mmWave, enabling both carriers to reach more people with faster 5G service. In Verizon’s case, they have more than 90 million people being covered with the carrier’s fastest Ultra Wideband 5G. AT&T is rolling out its C-Band 5G, though on a more limited basis currently.

C-Band tests have been done in a number of different locations and already seems to be improving performance for Verizon. Right after C-Band 5G went live, testing firm Ookla published a report claiming that Verizon’s average 5G download speed jumped to 116.3 Mbps from 76.5 Mbps within the course of a week. For comparison, T-Mobile speeds increased from 182 Mbps to 187.1 Mbps in that same time period.

With the recent upgrades and third party tests that have come out, it would seem the leader board is bound to shift by RootMetrics’ next test. Only time will tell!

T-Mobile Comes Out on Top of OpenSignal’s Latest Report

OpenSignal is known for its mobile analytics. Each year they release a few reports about the major cellular carriers’ networks. They take results gathered from millions of devices, which result in billions of measurements. The latest data gathered, which was collected between September and December of last year, shows T-Mobile is on top once again. 

Analysis was done in 43 states, as well as the capital of Washington, D.C., for each of the carriers strictly on their 5G network experience. The report covered: Availability, Reach, Games Experience, Voice App Experience, Download Speed and Upload Speed. 

T-Mobile was not the only winner though. Verizon also picked up the categories of Games Experience and Voice App Experience. Sadly, for AT&T, they didn’t win any categories, but still presented good results in comparison to its competitors. It’s no wonder given that T-Mobile has not had to deal with the issues surrounding C-Band that AT&T and Verizon have. This service was originally delayed, then limited to certain locations – all because of possible interference with aircraft tools that also work around the C-Band spectrum. 

While Verizon has the best user experience, T-Mobile dominates the speed categories. In fact, they’ve been at the top of the Download Speed category for six times in a row and Upload Speeds for the fifth time in a row. 

T-Mobile also won the Availability and Reach categories. It’s clear their lead on getting mid-band service out to 200 million users was a success. This is what they have dubbed their “Ultra Capacity 5G” service. It relies on the 2.5 Ghz band, so it is unaffected by the FAA concerns that have affected the C-Band. 

Now let’s take a closer look at how all the carriers fared in each category, at the National Analysis level. 

Note that each of the OpenSignal charts listed below have brackets at the end of their respective graphs. These brackets represent confidence intervals. Per OpenSignal, “For every metric we calculate statistical confidence intervals indicated on our graphs. When confidence intervals overlap, our measured results are too close to declare a winner. In those cases, we show a statistical draw. For this reason, some metrics have multiple operator winners. In our bar graphs we represent confidence intervals as boundaries on either sides of graph bars. In our supporting-metric charts we show confidence intervals as +/- numerical values.”

  1. 5G Availability

“Opensignal’s 5G Availability compares the amount of time 5G users spent with an active 5G connection — the higher the percentage, the more time that users on a network were actually connected to 5G.”

The brackets |-| represent confidence intervals.
  1. 5G Reach

“5G Reach represents the proportion of locations where 5G users have connected to 5G out of all the locations those users have visited, on a scale of 0-10. This measure complements our existing 5G Availability metric, which represents the proportion of time 5G users spent connected to 5G.”

The brackets |-| represent confidence intervals.
  1. 5G Games Experience

“Opensignal’s 5G Games Experience measures how mobile users experience real-time multiplayer mobile gaming on an operator’s 5G network. Measured on a scale of 0-100, it analyzes how the multiplayer mobile gaming experience is affected by mobile network conditions including latency, packet loss and jitter.”

The brackets |-| represent confidence intervals.
  1. 5G Voice App Experience

“Opensignal’s 5G Voice App Experience measures the quality of experience for over-the-top (OTT) voice services — mobile voice apps such as WhatsApp, Skype, Facebook Messenger etc. — when users are connected to a 5G network.”

The brackets |-| represent confidence intervals.
  1. 5G Download Speed

“T-Mobile’s 5G Download Speed continues on its upward trend as our users on the carrier now clock average speeds of 150 Mbps, up from 118.7 Mbps in the previous report. A year ago, using T-Mobile our users saw a 5G Download Speed score of 58.1 Mbps, but it has consistently increased since then due to T-Mobile’s ongoing deployment of 2.5 GHz spectrum. The carrier has been increasing both its population coverage, as well as the amount of spectrum deployed on that band.”

The brackets |-| represent confidence intervals.
  1. 5G Upload Speed

“T-Mobile keeps hold of the 5G Upload Speed award with a score of 17.9 Mbps, which is 1.8 Mbps faster than what our users observed in our October report. Verizon places second in 5G Upload Speed with a score of 14.1 Mbps, which represents a 0.3 Mbps decrease from our previous report, while AT&T’s score increased from 9.7 Mbps to 9.9 Mbps.”

The brackets |-| represent confidence intervals.

Analysis was also done at the regional level, which you’ll see outlined below.

Testing Verizon C-Band in New York City

Verizon’s new 5G network is live and PCMag just tested it out in New York City. In summary, C-Band made their connections about 50% faster, once they were able to find the signal. They also noted less congestion on the network, which is likely due to it still being so new. 

Starting this past Wednesday, Verizon launched its new form of 5G in 46 cities. AT&T did also, but only in eight cities. 

While PCMag reports the Verizon service being noticeably improved, it didn’t measure up to T-Mobile’s citywide “5G Ultra Capacity”— at least, not yet. T-Mobile currently has the most coverage in New York City and the best performance also in comparison to its competitors. 

Looking at reports from other cities, it seems that may not be the same as in New York City. Per PCMag’s report, “Redditors are busy posting spectacular C-Band speeds, including 859Mbps down in Los Angeles, 586Mbps outside Pittsburgh, and 413Mbps in Indianapolis.”

In order to test the C-Band, the PCMag team used the new Ookla WIND software. This is a carrier-grade package that runs on altered Samsung Galaxy S21+ phones. WIND’s Pro version, which the company supplied for testing, shows all the details of frequency band use you could ever need. It also lets testers build complex setups with voice, data, text, and video tests.

Verizon’s C-Band was a little hard to find during the New York tests. They ended up being able to use C-Band only on sites in two cities – Forest Hills and Kew Gardens. In other locations like East Harlem, their phone had refused to connect to C-Band, despite Ookla having identified the location as having C-Band available. It’s possible that some connections are being blocked by the carrier, or perhaps something to do with technical interference.

PCMag also addressed the “exclusion zones” that carriers agreed to with the FAA. Some of the exclusion zones are around JFK and LaGuardia airports. These are some of the busiest airports among a part of the city that is populated by about 2.3 million people. This is the same case for areas like Chicago, Dallas, and San Diego. Folks here unfortunately don’t have the benefits of the new 5G because of interference risks with aircraft altimeters

Per Verizon, the exclusion zones are a rectangle 2 miles long extending from the end of each airport runway. In one case during the tests, they were unable to find C-Band in an arc spanning from 4 miles southeast to 3 miles southwest of the end of the LaGuardia runway. That area covers many of Queens’ densest neighborhoods. Unexpectedly, though, they found more millimeter-wave in the exclusion zone than they expected to. 

“While the super-fast, short-range technology didn’t blanket the area, it kept popping up here and there throughout Long Island City, Astoria, Sunnyside, and Elmhurst, giving a huge boost when I could find it,” the article reads. 

They continued, “I can’t tell if Verizon’s avoidance of neighborhoods closer to LaGuardia is about the exclusion zone, or just the vagaries of early network buildouts. But we can confirm that while there’s no C-Band coverage within 2 miles of the airport, there is definitely coverage between 3-4 miles away.”

So just how fast is 5G? 

PCMag’s tests shows the in most cases, the C-Band service was double the speeds of LTE. This is because 5G was made more efficient and spread across multiple airwaves, making it able to provide more speed with less congestion on the networks. 

The article explained this more technically. “C-Band roughly doubles the airwaves Verizon had available for use in our tests. In most of our tests, Verizon used 40-50MHz of 4G LTE spectrum. When its “nationwide” 5G was active, it added 10MHz of low-band 5G to that. C-Band trades out that 10Hz of low-band 5G for 60MHz of mid-band, resulting in 100-110MHz being used.”

In comparison to tests run with T-Mobile, Verizon was just a little less. T-Mobile generally used 40MHz of 4G LTE along with 80MHz of mid-band 5G, for a total of 120MHz.

Tests were split between the carriers’ 4G and 5G components. PCMag found that in T-Mobile’s tests, 75% of the speed came from 5G, while in Verizon’s tests, 45-55% came from 5G. They also noticed that for some unknown reason, “each megahertz of Verizon’s was slower than a megahertz of T-Mobile’s—something the bigger carrier is surely working on optimizing.”

They also discovered something rather odd. “A bunch of our C-Band results in Kew Gardens all congregated around 140Mbps down in a way that makes me think it was a configuration issue or cap, not the capability of the network.”

What about the reach of the C-Band service?

The tests performed by the PCMag team have already shown T-Mobile is faster than Verizon on their mid-band spectrums – T-Mobile at its 2.5GHz frequency and Verizon at the higher C-Band spectrum.   The real question now is, which carrier delivers more range? PCMag says, “But the fact is, urban networks in places like New York, Chicago, and Dallas are dense enough that the difference may not matter.”

The case in Queens, for example, Verizon’s network is so dense that sites don’t have to broadcast very high to be received. It’s the same for T-Mobile here, whose extremely dense network in Queens has sites that are often a quarter-mile from each other or less.

From their findings, PCMag believes the jury is still out in the battle of mid-band distance. Though it is clear that C-Band has enough reach so that carriers won’t need to put a site every few blocks. 

Do I need C-Band now?While C-Band is available now, it can only get better as Verizon continues to roll out service. “In many other cities, it appears to already be better; my experience in Queens looks like the low end of the C-Band experience,” said the author of the article. They added, “The C-Band boost will come primarily to places within half a mile to a mile of a Verizon cell site, so look up your location on cellmapper.net if you’re curious. It’ll also require a recent phone.”