RootMetrics Reports on 2H 2022: How the Cellular Networks Compare

RootMetrics just released its report that measures overall network experience and performance for the most popular cellular networks in North America.

Test results were based on the second half of 2022 and cover all network technologies (5G, 4G LTE, and any sub-4G technology). The report also looks at the newest C-Band 5G performance for AT&T and Verizon. The test space for the report consists of the entirety of the United States, which includes 125 of the country’s most populated metropolitan markets (as defined by the United States Census Bureau’s Census Urbanized Areas [CUAs].

The report noted a few important points to take away regarding the three top cellular networks: AT&T, Verizon, and T-Mobile.

2022 RootMetrics Report Highlights for AT&T

AT&T won five national awards, including the U.S. Overall Performance RootScore Award. AT&T was also recognized within the Reliability, Speed, Data and Call categories. AT&T tied with Verizon for first in the Text category. Additionally, AT&T also took home the most State RootScore Awards. Its results in major cities were strong, but it came in second to Verizon. AT&T shows 5G speed gains in 70 C-Band markets. Overall, AT&T has clearly made some improvements, both in LTE and 5G. 

2022 RootMetrics Report Highlights for T-Mobile

Compared with its competitors, T-Mobile’s results showed great speeds. It took home 88 Speed RootScore Score Awards, which were higher than those of AT&T (59) or Verizon (71).

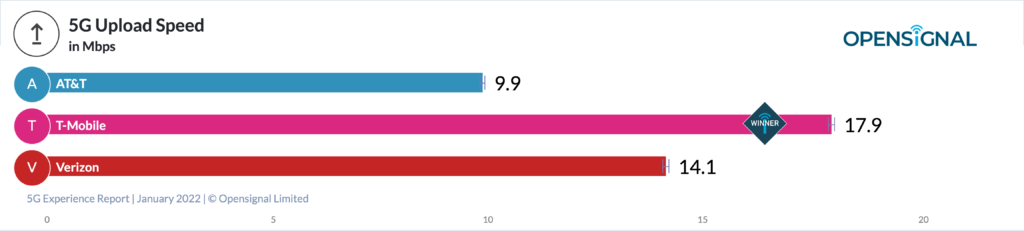
Out of all carriers, T-Mobile’s overall median download speeds measured above 50 Mbps in the most cities. T-Mobile was also the only carrier that posted median download speeds above 200 Mbps. These speeds were achieved in 59 markets.

Even more impressive is how in 32 of those cities, T-Mobile recorded median download speeds above 300 Mbps; additionally, it acheived 400 Mbps speeds in one city (Fort Wayne, Indiana). Overall, the carrier delivered the Fastest 5G and the Best Overall 5G Experience in the U.S. for the third time. It was recognized for its top 5G availability four years in a row.

2022 RootMetrics Report Highlights for Verizon

Verizon took home the most awards out of any carrier in major metropolitan markets — a total of 747 awards out of 875 total opportunities. This was a representation of roughly 85% of all possible network awards. Verizon demonstrated the best 5G reliability out of all cellular carriers and earned the second most state-level awards. Verizon showed improved speeds, including 5G C-Band speed increases: RootMetrics’ tests recorded Verizon’s C-Band in 102 of its 123 cities with 5G. Further, the carrier’s 5G speeds improved in nearly 90 of these markets since 1H 2022. Outstanding Verizon reliability has also been seen in major metros, compared to 1H 2022.

OpenSignal Reports: Who is the Best Cellular Provider?

OpenSignal has released their collection of data from cellular providers over the dates of September 16 to December 14 of 2022. It will be no surprise to some of us that in these cellular reports, T-Mobile has won out above the rest, yet again. 

On the mobile network experience report, multiple factors were tested. For overall experience, the cellular report included video, games, voice app, download speed, and upload speed. For coverage, they checked availability across the providers. Lastly, they checked for consistency in excellent quality and core quality. 

Experience and coverage might make sense, but what about consistency? Per OpenSignal, “Consistent Quality measures how often users’ experience on a network was sufficient to support common applications’ requirements. It measures download speed, upload speed, latency, jitter, packet loss, time to first byte and the percentage of tests attempted which did not succeed due to a connectivity issue on either the download or server response component.”

Core Consistent Quality represents common, but less demanding use cases such as SD video streaming, web browsing, and email use. Excellent Consistent Quality is designed for higher quality applications such as live video streaming and streaming video games. See how Consistent quality metrics are calculated here.

The only awards that T-Mobile did not take was in the Availability section. That award goes to the previous champion, AT&T. AT&T and Verizon were only 0.2 percentage points away from each other. T-Mobile came up last with a score of 98%.

OpenSignal’s 5G Experience Report awards were a bit of a toss up between Verizon and T-Mobile. The UnCarrier took a slight lead by winning in 4 categories (download and upload speeds, as well as availability and reach), versus Verizon’s 3 (Video, Games, and Voice app experiences). Much like the mobile network experience report, the 5G cellular report tests the same categories, but with 5G specifically, and less the consistency awards. Instead, in coverage, they checked both availability and reach.

Experience awards were all quite close, with Verizon just barely winning out over T-Mobile. The only exception being 5G download speeds. T-Mobile was the clear winner here, topping out at 186.3 Mbps versus 84.9 Mbps from Verizon and 71.1 Mbps from AT&T. Regarding coverage and 5G Availability, T-Mobile won again with a far lead of 30% over its closest competitor, AT&T. 

Per OpenSignal, “5G Reach measures the 5G mobile experience in all the locations that matter most to everyday users – i.e. all the places where they live, work and travel. 5G Reach for each operator is measured on a scale from 0 to 10.” The results were a bit closer on this one. With a score of 8.3, T-Mobile had a little over a 2 point lead ahead of AT&T and about 4 points from Verizon.  

Something to keep in mind when reviewing the results for yourself – tests were done at the national and regional level. While T-Mobile may be the majority winner, take note of the winners in your state. You may find a different provider is more appropriate.

How do I Purchase a Peplink License After My Warranty has Expired?

If you own a Peplink or Pepwave device, you may already be aware of their warranty renewal process. If not, you can read about it in detail here (see Renewal Policy). 

In cases where your device is outside of the 30 day grace period, you will need to supply something called a Diagnostic Report. This is a unique report that only the Peplink engineers can open and read. It is used not only to help diagnose device issues, but also to verify the device is operating properly. 

As long as the device’s operation is normal, the Report will pass Peplink Support’s test. If they find an issue however, it will cause a failure, in which case you may not be able to proceed with purchasing the warranty license. It is for this reason that we have implemented a new feature on our website. 

When you go to purchase a new warranty for your device, but you’re outside the grace period, you’ll be prompted to upload a Diagnostic Report. How exactly is that done you ask? There’s two ways to do this. Let’s take a look. 

Obtain Your Diagnostic Report through the Web Admin

First, we have the Web Admin method. If you are connected directly to your Peplink device via Ethernet or WiFi, and you can log into the web admin page, follow the steps* below. 

  1. Open a web browser and log into the web admin page (default login is admin/ admin)
    • For Balance routers, the default address is 192.168.1.1
    • For Max and SOHO routers, the default address is 192.168.50.1
  2. Navigate to the “Status” tab and confirm you’re at “Device” on the left (it should automatically load to this page)
  3. Find “Diagnostic Report” towards the bottom of the page
  4. Click “Download” (it may take a few moments to begin as it is loading the data)
  5. Save this file (you will not be able to open it)

*For a video of these steps, see below

Obtain Your Diagnostic Report through InControl 2

Alternatively, if you are remotely located from the device, but have access to it through InControl 2, you can download from there. Follow the steps** below.

  1. Log into your account at https://incontrol2.peplink.com
  2. Select the “Organization” and then the “Group” your device is saved within
  3. Select the device from the “Device List” here and you’ll be taken to the “Device Details” page
  4. On the left, see the “Information” section and click the “Show All” link beside the “Device Name” – Additional details will be revealed
  5. Find “Diagnostic Report” towards the bottom and click “Download
  6. A window will appear with a button that reads “Request for a report” – click this and wait while the request is sent to the device.
  7. After a few moments, a “Download” button will appear – click on this and save the file. 

**For a video of these steps, see below. 

If you need assistance or have any questions about this process, please don’t hesitate to reach out to us. We’re available Monday thru Friday from 9am to 6pm CST via phone, email, or chat.

Who is the fastest 5G carrier in the US?

According to the latest report from RootMetrics T-Mobile may have the fastest 5G speeds and greatest 5G availability, but what about reliability?

When measuring only 5G reliability, a different carrier, Verizon, came out on top.

The timing of this testing however, is important to note. 5G performance was done during the second half of 2021. At the start of the New Year, you may recall that Verizon and AT&T were finally able to turn on their new C-Band 5G coverare, which brings faster average speeds to a greater number of people (more than 90 million, according to Verizon). AT&T has only a handful of cities covered at this point.

The RootMetrics report gathered results from tests that were run in 125 of the largest cities in the U.S. In the end, they found T-Mobile had the fastest 5G download speeds in 48 markets, compared to three for Verizon and zero for AT&T. Median download speeds for T-Mobile topped 100 Mbps in more than half the cities RootMetrics tested in. In 26 markets, the speeds topped 200 Mbps.

T-Mobile was also determined to have the best 5G availability. With the highest availability in 83 tested markets, T-Mobile topped AT&T (62 markets) and Verizon (6 markets).

In comparison with 5G reliability, T-Mobile was actually found to have the lowest amount at 19. Verizon had the best in 93 markets, also topping AT&T, which only showed in 67 markets. 

These findings weren’t just determined by RootMetrics either. Their results are right inline with what has been seen from other third party testers. Back in January, OpenSignal published a 5G performance report in which T-Mobile not only had the fastest 5g download speeds, but was 93.9 Mbps faster than its closest rival. T-Mobile also came out on top for availability and reach.

When comparing T-Mobile’s approach to the 5G rollout to that of AT&T and Verizon’s, it’s clear that T-Mobile got ahead by using sub-6GHz spectrum to create a far-reaching 5G nationwide network. The network now reaches more than 310 million people. More recently, they’ve begun using mid-band spectrum — much of it obtained through the merger with Sprint — to boost speeds. T-Mobile calls this their Ultra Capacity 5G service and it covers some 210 million people.

Verizon and AT&T started their 5G journey by concentrating on mmWave-based 5G. This can be very fast, but has a limited range. mmWave-based towers are in select cities. To provide more coverage, but at slower speed, the two carriers use sub-6GHz 5G.

After a few delays and limitations AT&T and Verizon were able to roll out more coverage in January, this time on the faster C-Band spectrum. The higher band spectrum has a wider reach than mmWave, enabling both carriers to reach more people with faster 5G service. In Verizon’s case, they have more than 90 million people being covered with the carrier’s fastest Ultra Wideband 5G. AT&T is rolling out its C-Band 5G, though on a more limited basis currently.

C-Band tests have been done in a number of different locations and already seems to be improving performance for Verizon. Right after C-Band 5G went live, testing firm Ookla published a report claiming that Verizon’s average 5G download speed jumped to 116.3 Mbps from 76.5 Mbps within the course of a week. For comparison, T-Mobile speeds increased from 182 Mbps to 187.1 Mbps in that same time period.

With the recent upgrades and third party tests that have come out, it would seem the leader board is bound to shift by RootMetrics’ next test. Only time will tell!

T-Mobile Comes Out on Top of OpenSignal’s Latest Report

OpenSignal is known for its mobile analytics. Each year they release a few reports about the major cellular carriers’ networks. They take results gathered from millions of devices, which result in billions of measurements. The latest data gathered, which was collected between September and December of last year, shows T-Mobile is on top once again. 

Analysis was done in 43 states, as well as the capital of Washington, D.C., for each of the carriers strictly on their 5G network experience. The report covered: Availability, Reach, Games Experience, Voice App Experience, Download Speed and Upload Speed. 

T-Mobile was not the only winner though. Verizon also picked up the categories of Games Experience and Voice App Experience. Sadly, for AT&T, they didn’t win any categories, but still presented good results in comparison to its competitors. It’s no wonder given that T-Mobile has not had to deal with the issues surrounding C-Band that AT&T and Verizon have. This service was originally delayed, then limited to certain locations – all because of possible interference with aircraft tools that also work around the C-Band spectrum. 

While Verizon has the best user experience, T-Mobile dominates the speed categories. In fact, they’ve been at the top of the Download Speed category for six times in a row and Upload Speeds for the fifth time in a row. 

T-Mobile also won the Availability and Reach categories. It’s clear their lead on getting mid-band service out to 200 million users was a success. This is what they have dubbed their “Ultra Capacity 5G” service. It relies on the 2.5 Ghz band, so it is unaffected by the FAA concerns that have affected the C-Band. 

Now let’s take a closer look at how all the carriers fared in each category, at the National Analysis level. 

Note that each of the OpenSignal charts listed below have brackets at the end of their respective graphs. These brackets represent confidence intervals. Per OpenSignal, “For every metric we calculate statistical confidence intervals indicated on our graphs. When confidence intervals overlap, our measured results are too close to declare a winner. In those cases, we show a statistical draw. For this reason, some metrics have multiple operator winners. In our bar graphs we represent confidence intervals as boundaries on either sides of graph bars. In our supporting-metric charts we show confidence intervals as +/- numerical values.”

  1. 5G Availability

“Opensignal’s 5G Availability compares the amount of time 5G users spent with an active 5G connection — the higher the percentage, the more time that users on a network were actually connected to 5G.”

The brackets |-| represent confidence intervals.
  1. 5G Reach

“5G Reach represents the proportion of locations where 5G users have connected to 5G out of all the locations those users have visited, on a scale of 0-10. This measure complements our existing 5G Availability metric, which represents the proportion of time 5G users spent connected to 5G.”

The brackets |-| represent confidence intervals.
  1. 5G Games Experience

“Opensignal’s 5G Games Experience measures how mobile users experience real-time multiplayer mobile gaming on an operator’s 5G network. Measured on a scale of 0-100, it analyzes how the multiplayer mobile gaming experience is affected by mobile network conditions including latency, packet loss and jitter.”

The brackets |-| represent confidence intervals.
  1. 5G Voice App Experience

“Opensignal’s 5G Voice App Experience measures the quality of experience for over-the-top (OTT) voice services — mobile voice apps such as WhatsApp, Skype, Facebook Messenger etc. — when users are connected to a 5G network.”

The brackets |-| represent confidence intervals.
  1. 5G Download Speed

“T-Mobile’s 5G Download Speed continues on its upward trend as our users on the carrier now clock average speeds of 150 Mbps, up from 118.7 Mbps in the previous report. A year ago, using T-Mobile our users saw a 5G Download Speed score of 58.1 Mbps, but it has consistently increased since then due to T-Mobile’s ongoing deployment of 2.5 GHz spectrum. The carrier has been increasing both its population coverage, as well as the amount of spectrum deployed on that band.”

The brackets |-| represent confidence intervals.
  1. 5G Upload Speed

“T-Mobile keeps hold of the 5G Upload Speed award with a score of 17.9 Mbps, which is 1.8 Mbps faster than what our users observed in our October report. Verizon places second in 5G Upload Speed with a score of 14.1 Mbps, which represents a 0.3 Mbps decrease from our previous report, while AT&T’s score increased from 9.7 Mbps to 9.9 Mbps.”

The brackets |-| represent confidence intervals.

Analysis was also done at the regional level, which you’ll see outlined below.